Making complex data legible
The cost of an unexplained number
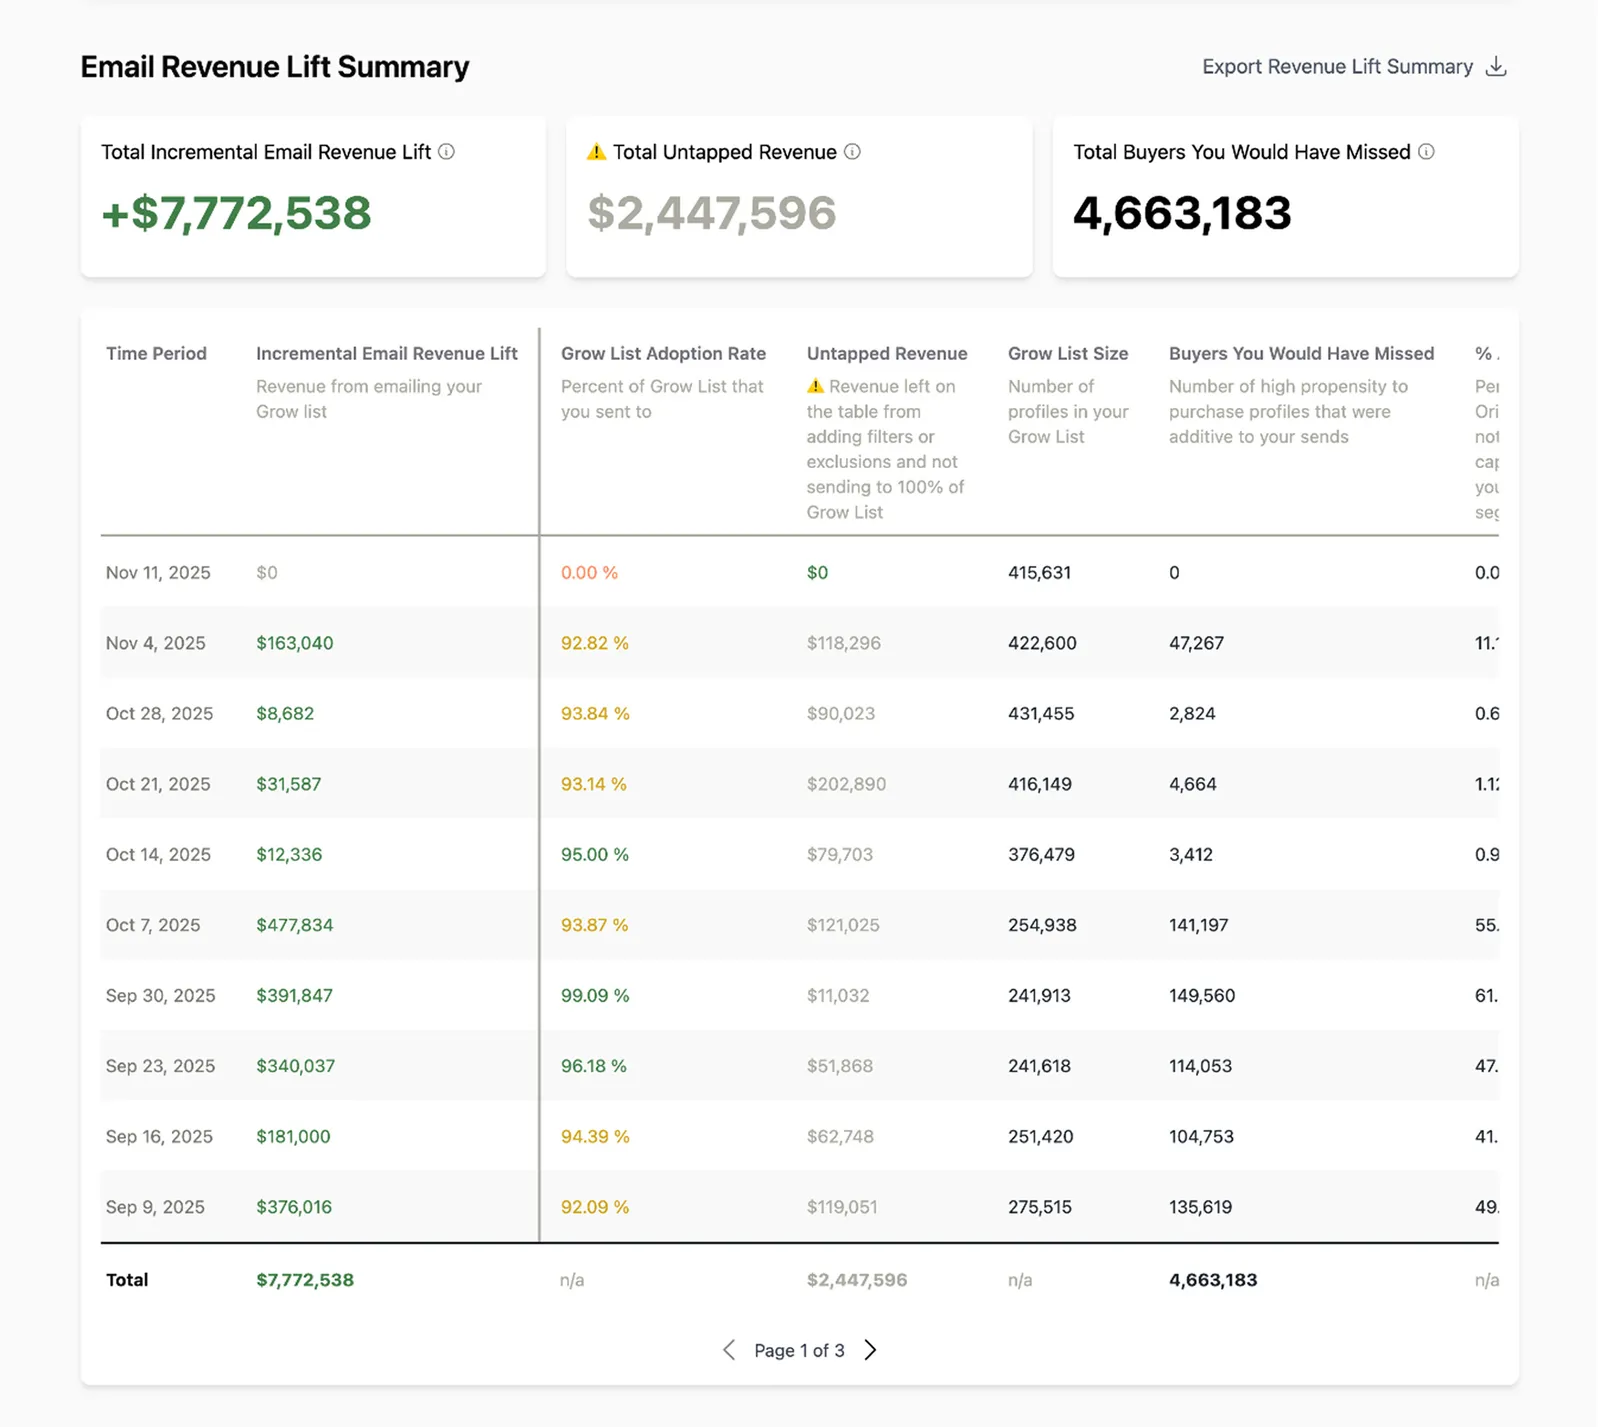
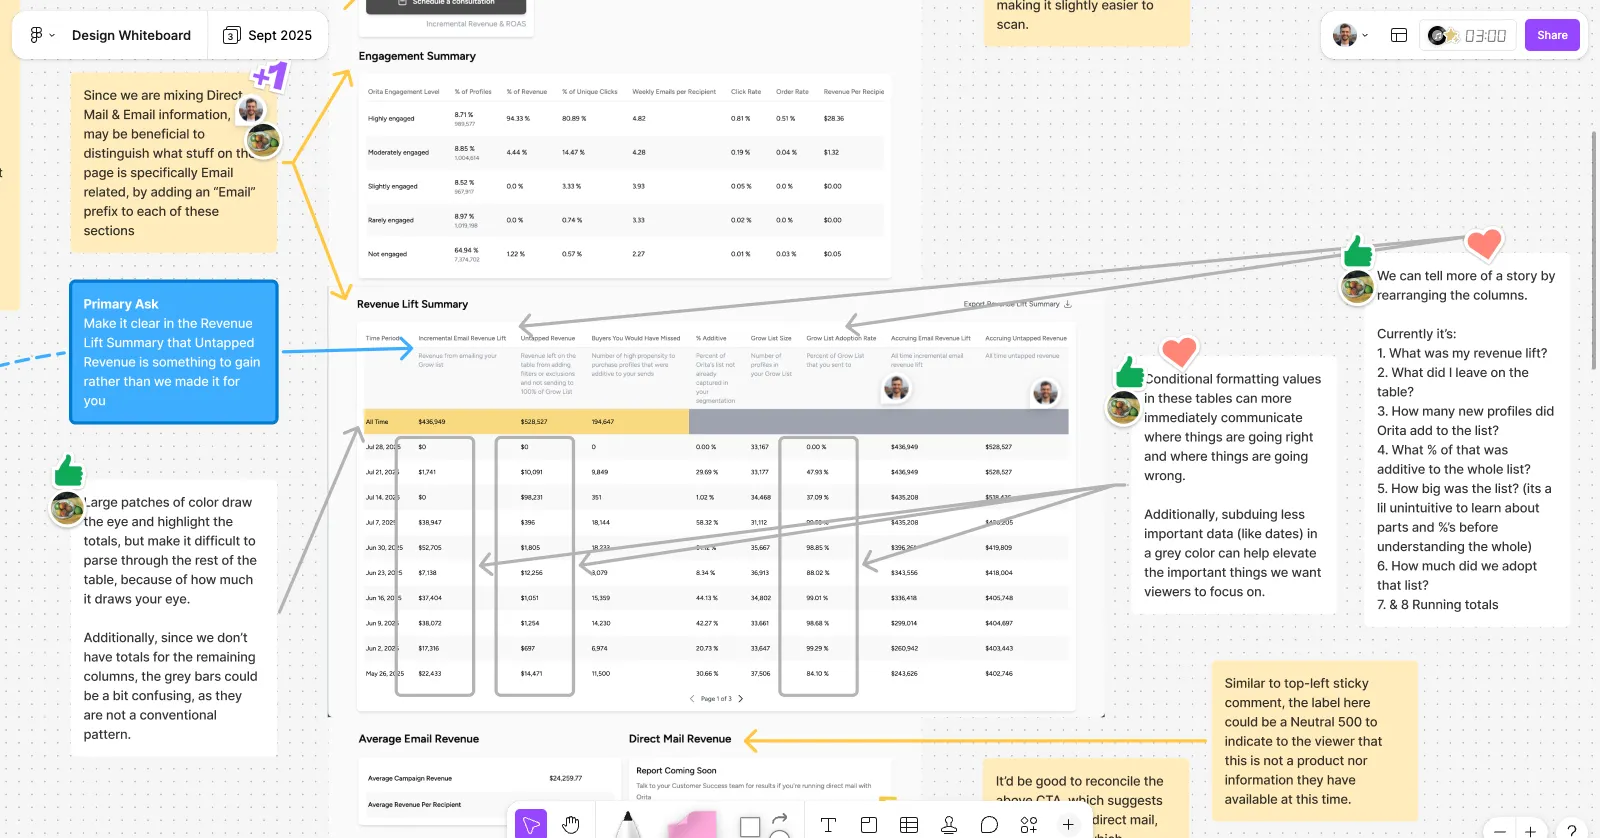
The gap between the model and its readers showed up everywhere I looked. An agency principal in my research interviews wouldn’t give her clients dashboard access at all; she screenshotted the parts she thought they’d follow into her own decks. Customers misread untapped revenue in the lift summary as revenue they earned; our customer success team watched it happen while presenting. In one month of 2026, four customers separately told us they couldn’t tell why a number in the dashboard was what it was.
When a model is right but can’t account for itself, it doesn’t get trusted — it gets misinterpreted, rebuilt by hand, or ignored.
Ranges over point estimates
- The constraint
- One week, a scenario planner built on the model's projections, and a teammate's AI-generated mockup as the starting point. The planner was the head of product's idea, a project lead ran customer discovery with five pilot brands, and I was formally assigned the design.
- The options
- A single projected number, as the starting mockup rendered it
- A range on the headline projection
- The full statistical detail up front
- The call
A projection rendered as one number reads as a promise the model can’t keep. When the actual lands outside it, the user doesn’t conclude the estimate had variance, they conclude the product lied. A range makes the model’s uncertainty part of the message instead of a footnote. I also rejected showing the full statistical detail up front, in favour of progressive disclosure, so the first read is simple and the proof is one layer down. The range only works paired with a stated posture, which is the argument I have made since March 2025: start from “this works and we’re confident in it; if you need proof, here it is.”
- The cost
- A range is harder to act on than a single number: a stakeholder who wants a target gets a span instead. I took that trade because the alternative degrades trust the first time reality disagrees.
the Campaign Planner MVP, shipped March 2026
The model has to show its workOrita’s product is a machine-learning model’s judgment: which customers an e-commerce brand should stop emailing, and what revenue that protects. The output is statistical. Lift, holdouts, projections. The customers reading it are marketers, and this is how the interface learned to do the explaining.